Income Inequality and Sexual Violence in Brazil (2015–2025)
Abstract
This study examines the temporal and spatial dynamics of rape victimization rates in Brazil between 2015 and 2025, disaggregated by sex and Federative Units. Using standardized rates per $100,000$ inhabitants, the analysis integrates descriptive statistics, three-year weighted moving averages, consistency indicators, and Local Indicators of Spatial Association (LISA) to identify structural patterns, temporal persistence, and localized spatial dependence. The results reveal pronounced regional disparities, with the North and Central-West regions consistently exhibiting the highest levels of female victimization. The LISA analysis further demonstrates that these elevated rates are not randomly distributed but form statistically significant and persistent High-High spatial clusters, indicating strong geographic concentration. Conversely, Low-Low clusters observed in parts of the Northeast and Southeast suggest spatially structured areas of lower vulnerability. Although male victimization rates are substantially lower, partially similar spatial patterns emerge, albeit with weaker and more fragmented spatial autocorrelation. The findings also indicate that, despite short-term fluctuations — particularly during the COVID-19 period — several states exhibit persistent upward trends, reinforcing the interpretation of structural rather than episodic dynamics. The temporary disruption and subsequent reconfiguration of spatial clusters further highlight the resilience of underlying spatial processes. Overall, the combined use of temporal and spatial analytical tools provides a more nuanced understanding of sexual violence in Brazil, emphasizing the coexistence of regional inequality, spatial dependence, and trend persistence. These findings underscore the need for geographically targeted public policies and improvements in data quality and reporting systems.
Keywords
sexual violence; spatial autocorrelation; Local Moran’s I; spatial clusters; Brazil.
Introduction
Sexual violence, particularly rape, has been widely studied across disciplines including public health, criminology, psychology, and sociology due to its profound and long‐term impacts on survivors’ physical and mental well‐being. The World Health Organization (WHO) defines rape as a form of sexual assault involving non‐consensual penetration, and emphasizes its prevalence as a global public health concern .
Epidemiological studies have sought to estimate the prevalence and correlates of rape across populations. For example, population‐based surveys in high‐income and low‐income countries have documented significant lifetime prevalence rates, with broad variation by region and gender. Such cross‐national research highlights the role of social, economic, and cultural determinants in shaping risk environments for sexual violence.
Theoretical frameworks for understanding rape include feminist perspectives that conceptualize sexual violence as rooted in gender inequalities and power dynamics. Similarly, social ecological models situate the individual within intersecting layers of influence, from interpersonal relationships to broader societal norms, to explain vulnerability and perpetration.
From a psychological perspective, research has emphasized the impacts of rape on mental health outcomes, showing associations with post‐traumatic stress, depression, and anxiety among survivors. These studies underscore the need for trauma‐informed interventions and services as part of comprehensive public health responses.
Criminological research has examined patterns of reporting, prosecution, and conviction, revealing systemic barriers that survivors face within legal systems. Such work calls attention to both the underreporting of rape and the importance of policy reforms to improve access to justice.
Through these diverse approaches, the literature demonstrates that rape is not only a criminal act but also a complex social phenomenon with multifaceted determinants and consequences. An interdisciplinary perspective is essential for effective research, prevention, and response strategies.
Conceptualizing Rape as a Complex Social Phenomenon
Rape is not merely an act of individual violence; it is widely understood across disciplines as a deeply entrenched social phenomenon influenced by intersecting cultural, structural, and institutional factors. Rather than occurring in isolation, sexual violence is produced within broader systems of gender inequality, power relations, social norms, and historical structures that shape both vulnerability and impunity.
One foundational perspective comes from feminist scholars who argue that rape cannot be fully understood outside the context of gendered power imbalances. Feminist theorists maintain that sexual violence reflects and reproduces patriarchal norms that subordinate women and sexual minorities. From this vantage, rape is not an aberration but a manifestation of systemic gender inequity, meaning that individual acts of sexual violence are rooted in social structures that legitimize domination and control.
Sociological frameworks extend this view by emphasizing the role of cultural norms and socialization processes. Social norms that tolerate aggression, reinforce rigid gender roles, or stigmatize victims contribute to environments in which sexual violence is normalized or minimized. These norms are often sustained through institutions such as media, education, and legal systems that reflect prevailing power dynamics.
Global public health research has further highlighted the complexity of sexual violence by demonstrating the interplay of individual, relational, community, and societal risk factors. The ecological framework conceptualizes sexual violence as the product of factors operating at multiple levels, ranging from individual history and behavior to cultural norms and economic inequalities.
Brazilian scholars have also contributed significantly to understanding sexual violence as a social phenomenon shaped by intersections of gender, race, class, and historical inequalities. Research in the Brazilian context reveals how patriarchal norms, machismo culture, and structural violence intersect to influence the prevalence, reporting, and social response to rape. Intersectionality, a framework developed to analyze how multiple axes of inequality (e.g., gender, race, class) shape experiences of violence, has been increasingly applied in Brazilian research to unpack how marginalized groups experience sexual violence differently}.
Beyond social structures, institutional responses including law enforcement, judicial processes, and health services play a critical role in shaping survivors’ trajectories and societal perceptions of sexual violence. Studies document how legal barriers, victim‐blaming attitudes, and inadequate institutional support mechanisms can compound the harm experienced by survivors and contribute to impunity.
In summary, rape is understood in the academic literature not as an isolated criminal event but as a complex social phenomenon that emerges from and is sustained by intersecting social, cultural, economic, and institutional dynamics. Addressing sexual violence therefore requires multifaceted strategies that extend beyond criminal justice responses to encompass cultural change, systemic reform, and intersectional analysis.
Methodology
This study adopts a quantitative, longitudinal, and comparative approach to analyze the evolution of rape victimization rates across Brazilian Federative Units (FUs) from 2015 to 2025, disaggregated by sex. The methodological framework is structured around three complementary analytical dimensions: (i) temporal trend analysis, (ii) spatial heterogeneity assessment, and (iii) consistency evaluation through directional indicators.The primary data consist of annual rates of rape victims per $100,000$ inhabitants, stratified by sex and FU. These rates are defined as:
$$ R_{i,t} = \frac{V_{i,t}}{P_{i,t}} \times 100{,}000 $$
where $R_{i,t}$ denotes the victimization rate in Federative Unit $i$ at time $t$, $V_{i,t}$ represents the number of reported victims, and $P_{i,t}$ corresponds to the total population in the same unit and period. Missing values in specific years were preserved to avoid introducing artificial bias through imputation, given the descriptive and exploratory nature of the analysis. All rates were standardized to ensure comparability across regions and over time.To enhance interpretability and reduce short-term volatility, a three-year moving weighted average was computed for each region:
$$ \tilde{R}{r,t} = w_1 R{r,t-2} + w_2 R_{r,t-1} + w_3 R_{r,t}$$
where $\tilde{R}_{r,t}$ is the smoothed rate for region $r$ at time $t$, and $w_1, w_2, w_3$ are the weights assigned to each year, such that $w_1 + w_2 + w_3 = 1$. In this study, equal weights are assumed ($w_1 = w_2 = w_3 = \frac{1}{3}$), ensuring a balanced contribution of each period.This procedure allows for the identification of medium-term trends while attenuating the influence of abrupt annual fluctuations. The regional vulnerability rankings were derived from these smoothed values, enabling a clearer comparison of structural patterns across Brazil’s macro-regions. Additionally, a consistency indicator - referred to as the trend score - was constructed to capture the directionality of year-to-year changes. For each FU and year, the indicator is defined as:
$$ S_{i,t} = \begin{cases} +1, & \text{if } R_{i,t} > R_{i,t-1} \ 0, & \text{if } R_{i,t} = R_{i,t-1} \ -1, & \text{if } R_{i,t} < R_{i,t-1} \end{cases} $$
The cumulative consistency score for each Federative Unit is then given by:
$$ C_i = \sum_{t=2}^{T} S_{i,t} $$
where $C_i$ represents the overall trend consistency for unit $i$, and $T$ is the total number of time periods. The cumulative sum of these scores provides a synthetic measure of temporal persistence, allowing the classification of FUs according to the consistency of upward or downward trends.At the regional level, aggregated consistency indicators were computed by averaging the FU-level scores:
$$ \bar{S}{r,t} = \frac{1}{N_r} \sum{i \in r} S_{i,t} $$
where $\bar{S}_{r,t}$ denotes the average trend score for region $r$ at time $t$, and $N_r$ is the number of Federative Units within region $r$. This aggregation allows the identification of broader spatial patterns in the evolution of victimization rates. This multi-layered approach-combining raw rates, smoothed indicators, and directional metrics-ensures a robust and comprehensive examination of both the magnitude and dynamics of sexual violence across Brazil. To investigate the presence of local spatial autocorrelation and identify spatial clusters, the Local Moran’s I statistic, also known as Local Indicators of Spatial Association (LISA), was employed. Unlike the global Moran’s I, which provides a single summary measure for the entire study area, LISA enables the decomposition of spatial dependence at the individual spatial unit level. Formally, the Local Moran’s I statistic for a given spatial unit $i$ is defined as:
$$ I_i = z_i \sum_{j=1}^{n} w_{ij} z_j $$
where $z_i = x_i - \bar{x}$ represents the deviation of the observed value $x_i$ from the mean $\bar{x}$, and $w_{ij}$ denotes the spatial weight between units $i$ and $j$, typically defined through a spatial weights matrix $\mathbf{W}$. The weights matrix reflects the spatial structure of the data, such as contiguity or distance-based relationships, and is often row-standardized. An alternative standardized formulation is given by:
$$ I_i = \frac{(x_i - \bar{x})}{S^2} \sum_{j=1}^{n} w_{ij} (x_j - \bar{x}) $$
where $S^2$ corresponds to the sample variance:
$$ S^2 = \frac{1}{n} \sum_{i=1}^{n} (x_i - \bar{x})^2. $$
The statistical significance of $I_i$ was assessed using permutation tests. A 20\ significance level was adopted to allow greater flexibility in the detection of statistically significant spatial clusters, particularly given the exploratory nature of the analysis and the relatively high spatial variability of the data.Based on the sign and magnitude of $I_i$, as well as the standardized values of $z_i$ and the spatial lag $\sum_j w_{ij} z_j$, each spatial unit can be classified into one of the following cluster types
-
High-High (HH): high values surrounded by high values (hot spots)
-
Low-Low (LL): low values surrounded by low values (cold spots)
-
High-Low (HL): high values surrounded by low values (spatial outliers)
-
Low-High (LH)}: low values surrounded by high values (spatial outliers).
These classifications enable a detailed spatial interpretation of local clustering patterns and are commonly visualized using LISA cluster maps. It is important to note that the interpretation of LISA results depends critically on the specification of the spatial weights matrix $\mathbf{W}$, as different definitions of neighborhood structure may lead to different clustering patterns. Therefore, robustness checks using alternative weighting schemes are recommended. In summary, the Local Moran’s I provides a powerful tool for detecting localized spatial dependence, uncovering heterogeneity that may be obscured by global measures, and supporting more nuanced spatial analyses.
Results and Discussion
The results reveal substantial heterogeneity in both the magnitude and temporal dynamics of rape victimization rates across Brazilian federal units (FUs) and regions, with pronounced differences between female and male populations.
As shown in Table 1, the distribution of female victimization rates and reveals a clear spatial gradient. The North and Central-West regions consistently present the highest levels, with extreme values observed in states such as Mato Grosso do Sul (MS), Rondônia (RO), and Amapá (AP), where rates frequently exceed 100 cases per $100{,}000$ inhabitants. In contrast, Northeastern states such as Ceará (CE) and Rio Grande do Norte (RN) display comparatively low and more stable rates over time. This contrast suggests the presence of structural regional inequalities, potentially related to differences in socioeconomic conditions, institutional capacity, and reporting systems.
Table 1: Rate of female rape victims per 100,000 inhabitants, total variation and moving average over three consecutive years - FU {#tab-1}
| FU | Region | 2015 | 2016 | 2017 | 2018 | 2019 | 2020 | 2021 | 2022 | 2023 | 2024 | 2025 | Total Var. (%) | 2015–2017 | 2016–2018 | 2017–2019 | 2018–2020 | 2019–2021 | 2020–2022 | 2021–2023 | 2022–2024 | 2023–2025 |
|---|---|---|---|---|---|---|---|---|---|---|---|---|---|---|---|---|---|---|---|---|---|---|
| SE | Northeast | 0.0 | 0.0 | 0.0 | 1.5 | 12.7 | 11.9 | 11.7 | 14.2 | 18.2 | 18.0 | 19.7 | – | 0.0 | 0.5 | 4.7 | 8.7 | 12.1 | 12.6 | 14.7 | 16.8 | 18.6 |
| AC | North | – | – | – | 17.3 | 29.0 | 20.8 | 29.5 | 55.9 | 56.4 | 40.0 | 25.3 | – | – | 5.8 | 15.4 | 22.4 | 26.5 | 35.4 | 47.3 | 50.8 | 40.6 |
| AL | Northeast | 9.7 | 9.0 | 13.3 | 9.8 | 11.1 | 8.9 | 13.2 | 13.5 | 13.3 | 15.1 | 10.5 | 7.8 | 10.6 | 10.7 | 11.4 | 9.9 | 11.1 | 11.9 | 13.3 | 14.0 | 13.0 |
| AM | North | 12.6 | 17.0 | 15.9 | 13.8 | 13.1 | 10.6 | 9.8 | 12.2 | 12.2 | 16.0 | 17.4 | 37.6 | 15.2 | 15.6 | 14.3 | 12.5 | 11.2 | 10.9 | 11.4 | 13.5 | 15.2 |
| AP | North | 85.1 | 103.4 | 0.0 | 97.8 | 44.3 | 31.1 | 40.8 | 34.7 | 36.1 | 33.4 | 30.9 | -63.7 | 62.8 | 67.1 | 47.4 | 57.7 | 38.8 | 35.6 | 37.2 | 34.8 | 33.5 |
| BA | Northeast | 10.8 | 11.0 | 11.8 | 12.1 | 12.5 | 10.4 | 34.2 | 14.3 | 15.0 | 14.9 | 13.2 | 23.0 | 11.2 | 11.6 | 12.1 | 11.7 | 19.0 | 19.6 | 21.2 | 14.7 | 14.4 |
| CE | Northeast | 10.1 | 10.6 | 10.4 | 9.1 | 9.7 | 6.8 | 7.0 | 7.6 | 6.9 | 6.5 | 6.3 | -37.8 | 10.4 | 10.0 | 9.7 | 8.5 | 7.8 | 7.1 | 7.2 | 7.0 | 6.6 |
| DF | Central-West | 42.7 | 36.9 | 45.8 | 18.7 | 17.1 | 15.3 | 14.4 | 14.0 | 17.8 | 18.5 | 15.8 | -62.9 | 41.8 | 33.8 | 27.2 | 17.1 | 15.6 | 14.6 | 15.4 | 16.7 | 17.4 |
| ES | Southeast | – | – | – | 56.7 | 63.2 | 55.4 | 53.7 | 65.9 | 19.0 | 71.2 | 15.7 | – | – | 18.9 | 40.0 | 58.4 | 57.5 | 58.4 | 46.2 | 52.0 | 35.3 |
| GO | Central-West | – | 15.7 | 19.0 | 21.8 | 24.4 | 18.4 | 22.5 | 20.7 | 19.5 | 19.7 | 18.0 | – | 11.6 | 18.9 | 21.8 | 21.6 | 21.8 | 20.5 | 20.9 | 20.0 | 19.1 |
| MA | Northeast | 22.0 | 24.0 | 28.0 | 27.7 | 34.0 | 32.2 | 13.3 | 12.1 | 10.5 | 9.8 | 10.9 | -50.4 | 24.7 | 26.6 | 29.9 | 31.3 | 26.5 | 19.2 | 12.0 | 10.8 | 10.4 |
| MG | Southeast | 16.1 | 15.7 | 15.8 | 15.7 | 13.4 | 11.3 | 10.9 | 10.2 | 10.9 | 12.5 | 11.3 | -29.4 | 15.9 | 15.8 | 15.0 | 13.5 | 11.9 | 10.8 | 10.7 | 11.2 | 11.6 |
| MS | Central-West | 41.2 | 50.9 | 60.9 | 142.0 | 154.7 | 141.3 | 138.9 | 132.9 | 162.0 | 133.4 | 86.1 | 108.9 | 51.0 | 84.6 | 119.2 | 146.0 | 145.0 | 137.7 | 144.6 | 142.7 | 127.2 |
| MT | Central-West | 28.9 | 39.0 | 41.4 | 37.9 | 38.4 | 35.7 | 32.1 | 33.4 | 34.5 | 33.4 | 34.0 | 17.7 | 36.4 | 39.4 | 39.2 | 37.3 | 35.4 | 33.7 | 33.3 | 33.8 | 33.9 |
| PA | North | 13.7 | 23.8 | 21.4 | 20.1 | 18.7 | 16.4 | 15.1 | 17.4 | 20.1 | 18.5 | 15.8 | 15.4 | 19.7 | 21.8 | 20.1 | 18.4 | 16.7 | 16.3 | 17.6 | 18.7 | 18.1 |
| PB | Northeast | 12.4 | 20.9 | 14.6 | 11.6 | 12.7 | 14.2 | 20.0 | 21.9 | 24.6 | 11.2 | 11.8 | -4.1 | 15.9 | 15.7 | 13.0 | 12.8 | 15.6 | 18.7 | 22.2 | 19.2 | 15.9 |
| PE | Northeast | 15.9 | 17.1 | 18.3 | 17.7 | 16.0 | 14.8 | 13.9 | 14.8 | 15.7 | 14.4 | 12.2 | -23.0 | 17.1 | 17.7 | 17.3 | 16.1 | 14.9 | 14.5 | 14.8 | 15.0 | 14.1 |
| PI | Northeast | 7.8 | 10.3 | 11.7 | 13.0 | 14.4 | 10.9 | 11.0 | 15.2 | 17.4 | 13.4 | 14.7 | 89.5 | 9.9 | 11.7 | 13.0 | 12.8 | 12.1 | 12.4 | 14.5 | 15.3 | 15.2 |
| PR | South | 16.6 | 19.1 | 22.6 | 22.9 | 23.4 | 20.7 | 22.3 | 24.8 | 26.8 | 29.0 | 22.6 | 36.1 | 19.4 | 21.5 | 23.0 | 22.3 | 22.1 | 22.6 | 24.6 | 26.9 | 26.2 |
| RJ | Southeast | 46.9 | 45.3 | 46.9 | 50.7 | 52.0 | 45.1 | 48.6 | 53.6 | 51.7 | 54.3 | 54.6 | 16.4 | 46.4 | 47.6 | 49.9 | 49.3 | 48.6 | 49.1 | 51.3 | 53.2 | 53.5 |
| RN | Northeast | 5.9 | 8.3 | 3.1 | 9.2 | 10.2 | 11.3 | 9.6 | 12.9 | 15.1 | 14.6 | 17.1 | 192.0 | 5.8 | 6.9 | 7.5 | 10.2 | 10.4 | 11.3 | 12.5 | 14.2 | 15.6 |
| RO | North | 53.6 | 65.1 | 100.0 | 122.2 | 125.0 | 104.1 | 108.4 | 108.7 | 166.0 | 157.7 | 27.3 | -49.1 | 72.9 | 95.7 | 115.7 | 117.1 | 112.5 | 107.1 | 127.7 | 144.1 | 117.0 |
| RR | North | 30.4 | 55.9 | 64.8 | 29.2 | 36.1 | 38.4 | 46.5 | 52.4 | 38.9 | 48.4 | 37.3 | 22.7 | 50.4 | 49.9 | 43.3 | 34.6 | 40.3 | 45.8 | 45.9 | 46.6 | 41.5 |
| RS | South | 27.7 | 26.8 | 28.2 | 32.7 | 23.8 | 18.6 | 18.5 | 18.8 | 19.5 | 18.3 | 16.3 | -41.3 | 27.6 | 29.2 | 28.2 | 25.0 | 20.3 | 18.6 | 18.9 | 18.9 | 18.0 |
| SC | South | 55.5 | 65.2 | 69.9 | 78.1 | 104.8 | 29.0 | 37.9 | 38.4 | 37.1 | 36.9 | 27.6 | -50.3 | 63.5 | 71.1 | 84.3 | 70.6 | 57.2 | 35.1 | 37.8 | 37.5 | 33.9 |
| SP | Southeast | 40.6 | 34.7 | 15.1 | 14.2 | 13.6 | 11.3 | 10.4 | 11.9 | 13.3 | 13.5 | 13.2 | -67.6 | 30.1 | 21.3 | 14.3 | 13.0 | 11.7 | 11.2 | 11.9 | 12.9 | 13.3 |
| TO | North | 25.7 | 37.3 | 45.8 | 86.9 | 98.1 | 19.5 | 22.7 | 21.9 | 91.0 | 25.7 | 19.9 | -22.6 | 36.3 | 56.7 | 77.0 | 68.2 | 46.8 | 21.4 | 45.2 | 46.2 | 45.5 |
Beyond cross-sectional disparities, the temporal evolution of female victimization rates indicates important structural shifts. Several FUs exhibit sharp increases between 2018 and 2019, followed by partial declines in 2020. This pattern is consistent with disruptions associated with the COVID-19 pandemic, which may have affected both the incidence of violence and, more importantly, reporting mechanisms. Notably, the subsequent period (2021–2025) shows renewed upward trends in multiple states, reinforcing the interpretation that the pandemic likely produced a temporary suppression of reported cases rather than a sustained reduction in underlying violence.
Regional heterogeneity is also evident within more developed areas. In the Southeast, São Paulo (SP) and Minas Gerais (MG) exhibit relatively low and declining trajectories, suggesting gradual improvements or stabilization. In contrast, Rio de Janeiro (RJ) maintains persistently high rates throughout the period, while Espírito Santo (ES) shows marked volatility, with abrupt fluctuations that may reflect inconsistencies in reporting or localized shocks. These intra-regional differences highlight that aggregate regional patterns may obscure substantial subnational variation.
Table 2, which presents male victimization rates, reinforces the strongly gendered nature of sexual violence, as levels are systematically lower across all FUs. However, the spatial distribution of male victimization partially mirrors that observed among females. The Central-West region, particularly Mato Grosso do Sul (MS), again stands out with comparatively elevated rates, suggesting that underlying structural risk factors — such as social vulnerability, violence dynamics, and institutional effectiveness — affect both sexes, albeit with different magnitudes.
Table 2: Rate of male rape victims per 100,000 inhabitants, total variation and moving average over three consecutive years - FU
| FU | Region | 2015 | 2016 | 2017 | 2018 | 2019 | 2020 | 2021 | 2022 | 2023 | 2024 | 2025 | Total Var. (%) | 2015–2017 | 2016–2018 | 2017–2019 | 2018–2020 | 2019–2021 | 2020–2022 | 2021–2023 | 2022–2024 | 2023–2025 |
|---|---|---|---|---|---|---|---|---|---|---|---|---|---|---|---|---|---|---|---|---|---|---|
| SE | Northeast | 0.0 | 0.0 | 0.0 | 0.2 | 2.0 | 1.3 | 1.9 | 1.4 | 0.8 | 1.8 | 0.8 | – | 0.0 | 0.1 | 0.7 | 1.1 | 1.7 | 1.5 | 1.4 | 1.3 | 1.1 |
| AC | North | – | – | – | 1.8 | 2.3 | 1.8 | 2.0 | 3.5 | 1.3 | 4.0 | 0.4 | – | – | 0.6 | 1.4 | 2.0 | 2.0 | 2.4 | 2.3 | 2.9 | 1.9 |
| AL | Northeast | 0.8 | 0.4 | 1.2 | 1.0 | 0.9 | 0.6 | 0.9 | 0.5 | 0.6 | 1.5 | 1.0 | 37.4 | 0.8 | 0.9 | 1.0 | 0.8 | 0.8 | 0.7 | 0.7 | 0.9 | 1.0 |
| AM | North | 0.8 | 1.6 | 1.8 | 0.9 | 1.0 | 0.5 | 0.4 | 0.6 | 1.2 | 1.3 | 1.1 | 35.2 | 1.4 | 1.4 | 1.2 | 0.8 | 0.6 | 0.5 | 0.7 | 1.0 | 1.2 |
| AP | North | 9.5 | 9.8 | 0.0 | 10.6 | 1.9 | 0.9 | 1.1 | 1.1 | 1.3 | 2.8 | 1.3 | -86.5 | 6.4 | 6.8 | 4.2 | 4.5 | 1.3 | 1.1 | 1.2 | 1.7 | 1.8 |
| BA | Northeast | 0.8 | 0.8 | 0.9 | 0.8 | 0.8 | 0.8 | 4.7 | 0.9 | 1.2 | 1.2 | 0.8 | 2.4 | 0.9 | 0.9 | 0.9 | 0.8 | 2.1 | 2.1 | 2.3 | 1.1 | 1.1 |
| CE | Northeast | 1.3 | 0.9 | 1.1 | 1.0 | 0.9 | 0.8 | 0.6 | 0.7 | 0.6 | 0.7 | 0.7 | -43.1 | 1.1 | 1.0 | 1.0 | 0.9 | 0.8 | 0.7 | 0.7 | 0.7 | 0.7 |
| DF | Central-West | 8.1 | 5.0 | 7.3 | 2.3 | 1.5 | 1.9 | 2.0 | 1.6 | 2.3 | 1.6 | 1.2 | -85.0 | 6.8 | 4.9 | 3.7 | 1.9 | 1.8 | 1.8 | 1.9 | 1.8 | 1.7 |
| ES | Southeast | – | – | – | 8.8 | 11.2 | 7.5 | 8.1 | 8.4 | 1.8 | 12.3 | 1.6 | – | – | 2.9 | 6.7 | 9.2 | 9.0 | 8.0 | 6.1 | 7.5 | 5.2 |
| GO | Central-West | – | 0.8 | 1.4 | 1.2 | 1.3 | 1.2 | 1.4 | 1.6 | 1.6 | 1.0 | 1.4 | – | 0.7 | 1.1 | 1.3 | 1.2 | 1.3 | 1.4 | 1.5 | 1.4 | 1.4 |
| MA | Northeast | 5.0 | 5.7 | 6.2 | 6.4 | 5.5 | 5.6 | 1.0 | 0.4 | 0.3 | 0.4 | 0.7 | -85.9 | 5.6 | 6.1 | 6.0 | 5.8 | 4.0 | 2.3 | 0.6 | 0.4 | 0.5 |
| MG | Southeast | 1.4 | 1.1 | 1.1 | 0.9 | 0.8 | 0.8 | 0.7 | 0.5 | 0.8 | 0.9 | 0.9 | -31.3 | 1.2 | 1.0 | 1.0 | 0.8 | 0.8 | 0.6 | 0.7 | 0.7 | 0.9 |
| MS | Central-West | 4.7 | 5.8 | 8.1 | 21.2 | 22.7 | 18.9 | 17.4 | 15.1 | 19.8 | 17.9 | 12.0 | 156.3 | 6.2 | 11.7 | 17.3 | 20.9 | 19.7 | 17.1 | 17.4 | 17.6 | 16.6 |
| MT | Central-West | 2.3 | 3.2 | 3.2 | 3.3 | 2.9 | 2.5 | 3.2 | 3.0 | 2.1 | 3.5 | 2.3 | 1.2 | 2.9 | 3.2 | 3.2 | 2.9 | 2.9 | 2.9 | 2.8 | 2.9 | 2.6 |
| PA | North | 0.5 | 1.1 | 0.8 | 1.1 | 1.1 | 0.9 | 0.7 | 1.1 | 1.0 | 1.2 | 1.1 | 103.1 | 0.8 | 1.0 | 1.0 | 1.1 | 0.9 | 0.9 | 0.9 | 1.1 | 1.1 |
| PB | Northeast | 2.0 | 1.9 | 3.2 | 0.9 | 1.6 | 0.8 | 1.9 | 2.4 | 2.6 | 0.8 | 0.8 | -59.8 | 2.4 | 2.0 | 1.9 | 1.1 | 1.5 | 1.7 | 2.3 | 1.9 | 1.4 |
| PE | Northeast | 1.5 | 2.0 | 1.7 | 1.8 | 2.1 | 1.1 | 1.4 | 1.3 | 1.1 | 0.9 | 1.3 | -10.0 | 1.7 | 1.8 | 1.9 | 1.7 | 1.6 | 1.3 | 1.3 | 1.1 | 1.1 |
| PI | Northeast | 0.7 | 1.1 | 1.3 | 0.7 | 1.1 | 0.7 | 1.4 | 1.3 | 0.5 | 1.1 | 1.2 | 70.8 | 1.0 | 1.0 | 1.0 | 0.8 | 1.1 | 1.1 | 1.0 | 0.9 | 0.9 |
| PR | South | 2.6 | 2.4 | 2.7 | 2.6 | 2.7 | 2.1 | 2.2 | 2.4 | 2.5 | 2.9 | 2.3 | -9.1 | 2.6 | 2.6 | 2.7 | 2.5 | 2.4 | 2.3 | 2.4 | 2.6 | 2.6 |
| RJ | Southeast | 8.7 | 7.5 | 8.6 | 8.5 | 8.4 | 7.2 | 7.5 | 7.7 | 8.2 | 8.5 | 8.3 | -5.0 | 8.3 | 8.2 | 8.5 | 8.1 | 7.7 | 7.5 | 7.8 | 8.2 | 8.3 |
| RN | Northeast | 0.2 | 0.6 | 0.1 | 0.4 | 1.2 | 0.5 | 0.6 | 0.9 | 0.8 | 1.1 | 1.4 | 481.0 | 0.3 | 0.4 | 0.5 | 0.7 | 0.8 | 0.7 | 0.8 | 0.9 | 1.1 |
| RO | North | 9.5 | 10.4 | 11.2 | 16.0 | 15.3 | 12.9 | 9.2 | 10.3 | 19.2 | 19.2 | 2.7 | -71.2 | 10.4 | 12.6 | 14.2 | 14.7 | 12.5 | 10.8 | 12.9 | 16.2 | 13.7 |
| RR | North | 2.3 | 1.5 | 3.6 | 4.7 | 1.9 | 3.4 | 1.5 | 1.1 | 3.4 | 3.9 | 2.7 | 18.5 | 2.5 | 3.3 | 3.4 | 3.3 | 2.3 | 2.0 | 2.0 | 2.8 | 3.3 |
| RS | South | 3.8 | 3.2 | 3.0 | 3.9 | 2.0 | 1.1 | 1.4 | 1.2 | 1.3 | 1.3 | 1.2 | -69.9 | 3.3 | 3.4 | 3.0 | 2.3 | 1.5 | 1.2 | 1.3 | 1.3 | 1.3 |
| SC | South | 10.1 | 10.8 | 11.4 | 13.0 | 16.7 | 2.8 | 3.7 | 3.7 | 3.8 | 4.6 | 2.9 | -71.2 | 10.8 | 11.7 | 13.7 | 10.8 | 7.7 | 3.4 | 3.7 | 4.0 | 3.8 |
| SP | Southeast | 10.3 | 8.3 | 1.5 | 1.3 | 1.1 | 1.1 | 1.0 | 1.2 | 0.9 | 1.0 | 1.1 | -89.4 | 6.7 | 3.7 | 1.3 | 1.2 | 1.1 | 1.1 | 1.0 | 1.0 | 1.0 |
| TO | North | 3.7 | 10.9 | 7.5 | 10.1 | 11.5 | 1.5 | 0.6 | 1.3 | 9.5 | 2.6 | 0.7 | -80.6 | 7.4 | 9.5 | 9.7 | 7.7 | 4.5 | 1.2 | 3.8 | 4.5 | 4.3 |
From a temporal perspective, male victimization rates exhibit lower volatility and a narrower dispersion across FUs when compared to female rates. This pattern may indicate more stable reporting dynamics, although it may also reflect persistent underreporting among male victims. Despite this overall stability, some states — notably Rondônia (RO) and Amapá (AP) — display episodic spikes, which could be associated with localized changes in violence patterns or improvements in detection and reporting systems.
Taken together, the results from both tables suggest that sexual violence in Brazil is characterized by strong regional inequalities, temporal discontinuities associated with external shocks such as the pandemic, and a pronounced gender asymmetry. While female victimization remains substantially higher, the persistence of similar spatial patterns across sexes points to common structural determinants that warrant further investigation.
The regional vulnerability rankings based on three-year weighted averages (Table 3 and Table 4) provide a clearer picture of structural inequalities. For females, the Central-West and North regions consistently occupy the highest positions, confirming their status as areas of greater vulnerability. The Northeast, while showing moderate levels, demonstrates relative stability over time. In contrast, the Southeast and South regions maintain lower averages, although not uniformly, as evidenced by the persistent high rates in specific states such as Rio de Janeiro.
Table 3: Regional female vulnerability ranking
| Region | 2015 | 2016 | 2017 | 2018 | 2019 | 2020 | 2021 | 2022 | 2023 | 2024 | 2025 |
|---|---|---|---|---|---|---|---|---|---|---|---|
| Northeast | 10.5 | 12.4 | 12.4 | 12.4 | 14.8 | 13.5 | 14.9 | 14.1 | 15.2 | 13.1 | 13.0 |
| North | 36.8 | 50.4 | 41.3 | 61.6 | 55.9 | 36.7 | 40.6 | 41.2 | 60.7 | 49.9 | 24.8 |
| Central-West | 37.6 | 42.3 | 49.4 | 66.2 | 70.1 | 64.1 | 61.8 | 60.1 | 71.4 | 61.7 | 45.3 |
| Southeast | 34.5 | 31.9 | 25.9 | 26.9 | 26.3 | 22.5 | 23.3 | 25.3 | 25.3 | 26.8 | 26.4 |
| South | 33.3 | 37.0 | 40.2 | 44.5 | 50.7 | 22.8 | 26.2 | 27.3 | 27.8 | 28.1 | 22.2 |
For males, the regional hierarchy is similar but less pronounced. The Central-West again emerges as the most vulnerable region, followed by the North, while the Northeast consistently presents the lowest averages. Notably, the temporal evolution suggests a general decline in male victimization rates after 2019, particularly in the North region, where the weighted average drops significantly by 2025.
Table 4: Regional male vulnerability ranking
| Region | 2015 | 2016 | 2017 | 2018 | 2019 | 2020 | 2021 | 2022 | 2023 | 2024 | 2025 |
|---|---|---|---|---|---|---|---|---|---|---|---|
| Northeast | 1.4 | 1.5 | 1.7 | 1.5 | 1.8 | 1.4 | 1.6 | 1.1 | 0.9 | 1.1 | 1.0 |
| North | 4.4 | 5.9 | 4.2 | 7.2 | 5.5 | 3.3 | 2.2 | 2.6 | 5.9 | 5.2 | 1.6 |
| Central-West | 5.0 | 4.7 | 6.2 | 8.9 | 9.0 | 7.8 | 7.5 | 6.6 | 8.0 | 7.7 | 5.2 |
| Southeast | 6.8 | 5.7 | 3.7 | 3.6 | 3.5 | 3.0 | 3.0 | 3.2 | 3.3 | 3.5 | 3.4 |
| South | 5.5 | 5.5 | 5.7 | 6.5 | 7.1 | 2.0 | 2.4 | 2.5 | 2.5 | 3.0 | 2.1 |
The consistency indicators at the FU level (Table 5 and Table 6) offer further insights into the persistence of trends. Among females, states such as Piauí (PI) and Paraná (PR) achieve the highest scores, indicating a sustained upward trajectory in victimization rates. Conversely, states like Amapá (AP), Distrito Federal (DF), and São Paulo (SP) display negative scores, reflecting either declining trends or high volatility with frequent reversals.
Table 5: Consistency indicator (Trend score) for females by FU
| UF | Region | 2015 | 2016 | 2017 | 2018 | 2019 | 2020 | 2021 | 2022 | 2023 | 2024 | 2025 | Ranking |
|---|---|---|---|---|---|---|---|---|---|---|---|---|---|
| SE | Northeast | 0 | 0 | 0 | 1 | 1 | -1 | -1 | 1 | 1 | 1 | 1 | 4 |
| AC | North | NA | NA | NA | 1 | 1 | -1 | 1 | 1 | 1 | -1 | -1 | 2 |
| AL | Northeast | 0 | -1 | 1 | -1 | 1 | -1 | 1 | 1 | -1 | 1 | -1 | 0 |
| AM | North | 0 | 1 | -1 | -1 | -1 | -1 | -1 | 1 | 0 | 1 | 1 | -1 |
| AP | North | 0 | 1 | -1 | 1 | -1 | -1 | 1 | -1 | -1 | -1 | -1 | -4 |
| BA | Northeast | 0 | 1 | 1 | 1 | 1 | -1 | 1 | -1 | 1 | -1 | -1 | 2 |
| CE | Northeast | 0 | 1 | -1 | -1 | 1 | -1 | 1 | 1 | -1 | -1 | -1 | -2 |
| DF | Central-West | 0 | -1 | 1 | -1 | -1 | -1 | -1 | -1 | 1 | 1 | -1 | -4 |
| ES | Southeast | NA | NA | NA | 0 | 1 | -1 | -1 | 1 | -1 | 1 | -1 | -1 |
| GO | Central-West | NA | 0 | 1 | 1 | 1 | -1 | 1 | -1 | -1 | 1 | -1 | 1 |
| MA | Northeast | 0 | 1 | 1 | -1 | 1 | -1 | -1 | -1 | -1 | -1 | 1 | -2 |
| MG | Southeast | 0 | -1 | 1 | -1 | -1 | -1 | -1 | -1 | 1 | 1 | -1 | -4 |
| MS | Central-West | 0 | 1 | 1 | 1 | 1 | -1 | -1 | -1 | 1 | -1 | -1 | 0 |
| MT | Central-West | 0 | 1 | 1 | -1 | 1 | -1 | -1 | 1 | 1 | -1 | 1 | 2 |
| PA | North | 0 | 1 | -1 | -1 | -1 | -1 | -1 | 1 | 1 | 1 | -1 | -2 |
| PB | Northeast | 0 | 1 | -1 | -1 | 1 | 1 | 1 | 1 | 1 | -1 | 1 | 4 |
| PE | Northeast | 0 | 1 | 1 | -1 | -1 | -1 | -1 | 1 | 1 | -1 | -1 | -2 |
| PI | Northeast | 0 | 1 | 1 | 1 | 1 | -1 | 1 | 1 | 1 | -1 | 1 | 6 |
| PR | South | 0 | 1 | 1 | 1 | 1 | -1 | 1 | 1 | 1 | 1 | -1 | 6 |
| RJ | Southeast | 0 | -1 | 1 | 1 | 1 | -1 | 1 | 1 | -1 | 1 | 1 | 4 |
| RN | Northeast | 0 | 1 | -1 | 1 | 1 | 1 | -1 | 1 | 1 | -1 | 1 | 4 |
| RO | North | 0 | 1 | 1 | 1 | 1 | -1 | 1 | 1 | 1 | -1 | -1 | 4 |
| RR | North | 0 | 1 | 1 | -1 | 1 | 1 | 1 | 1 | -1 | 1 | -1 | 4 |
| RS | South | 0 | -1 | 1 | 1 | -1 | -1 | -1 | 1 | 1 | -1 | 1 | 0 |
| SC | South | 0 | 1 | 1 | 1 | 1 | -1 | 1 | 1 | -1 | -1 | -1 | 2 |
| SP | Southeast | 0 | -1 | -1 | -1 | -1 | -1 | -1 | 1 | 1 | 1 | -1 | -4 |
| TO | North | 0 | 1 | 1 | 1 | 1 | -1 | 1 | -1 | 1 | -1 | -1 | 2 |
For males, the pattern is less consistent, with fewer states exhibiting strong positive or negative cumulative scores. Santa Catarina (SC) stands out with the highest positive ranking, suggesting a persistent increase, whereas Rio Grande do Sul (RS) shows the most negative score, indicating a consistent decline.
Table 6: Consistency indicator (Trend score) for males by FU
| FU | Region | 2015 | 2016 | 2017 | 2018 | 2019 | 2020 | 2021 | 2022 | 2023 | 2024 | 2025 | Ranking |
|---|---|---|---|---|---|---|---|---|---|---|---|---|---|
| SE | Northeast | 0 | 0 | 0 | 1 | 1 | -1 | 1 | -1 | -1 | 1 | -1 | 0 |
| AC | North | NA | NA | NA | 0 | 1 | -1 | 1 | 1 | -1 | 1 | -1 | 1 |
| AL | Northeast | 0 | -1 | 1 | -1 | -1 | -1 | 1 | -1 | -1 | 1 | -1 | -4 |
| AM | North | 0 | 1 | 1 | -1 | 1 | -1 | -1 | 1 | 1 | 1 | -1 | 2 |
| AP | North | 0 | 1 | -1 | 1 | -1 | -1 | -1 | 0 | 1 | 1 | -1 | -1 |
| BA | Northeast | 0 | 0 | 1 | -1 | 0 | 0 | 1 | -1 | 1 | 0 | 0 | 1 |
| CE | Northeast | 0 | -1 | 1 | -1 | -1 | -1 | -1 | 1 | -1 | 1 | 0 | -3 |
| DF | Central-West | 0 | -1 | 1 | -1 | -1 | 1 | 1 | -1 | 1 | -1 | -1 | -2 |
| ES | Southeast | NA | NA | NA | 0 | 1 | -1 | 1 | 1 | -1 | 1 | -1 | 1 |
| GO | Central-West | NA | 0 | 1 | -1 | 1 | -1 | 1 | 1 | 0 | -1 | 1 | 2 |
| MA | Northeast | 0 | 1 | 1 | 1 | -1 | 1 | -1 | -1 | -1 | 1 | 1 | 2 |
| MG | Southeast | 0 | -1 | 0 | -1 | -1 | 0 | -1 | -1 | 1 | 1 | 0 | -3 |
| MS | Central-West | 0 | 1 | 1 | 1 | 1 | -1 | -1 | -1 | 1 | -1 | -1 | 0 |
| MT | Central-West | 0 | 1 | 0 | 1 | -1 | -1 | 1 | -1 | -1 | 1 | -1 | -1 |
| PA | North | 0 | 1 | -1 | 1 | 0 | -1 | -1 | 1 | -1 | 1 | -1 | -1 |
| PB | Northeast | 0 | -1 | 1 | -1 | 1 | -1 | 1 | 1 | 1 | -1 | 0 | 1 |
| PE | Northeast | 0 | 1 | -1 | 1 | 1 | -1 | 1 | -1 | -1 | -1 | 1 | 0 |
| PI | Northeast | 0 | 1 | 1 | -1 | 1 | -1 | 1 | -1 | -1 | 1 | 1 | 2 |
| PR | South | 0 | -1 | 1 | -1 | 1 | -1 | 1 | 1 | 1 | 1 | -1 | 2 |
| RJ | Southeast | 0 | -1 | 1 | -1 | -1 | -1 | 1 | 1 | 1 | 1 | -1 | 0 |
| RN | Northeast | 0 | 1 | -1 | 1 | 1 | -1 | 1 | 1 | -1 | 1 | 1 | 4 |
| RO | North | 0 | 1 | 1 | 1 | -1 | -1 | -1 | 1 | 1 | 0 | -1 | 1 |
| RR | North | 0 | -1 | 1 | 1 | -1 | 1 | -1 | -1 | 1 | 1 | -1 | 0 |
| RS | South | 0 | -1 | -1 | 1 | -1 | -1 | 1 | -1 | -1 | 0 | -1 | -5 |
| SC | South | 0 | 1 | 1 | 1 | 1 | -1 | 1 | 0 | 1 | 1 | -1 | 5 |
| SP | Southeast | 0 | -1 | -1 | -1 | -1 | 0 | -1 | 1 | -1 | 1 | 1 | -3 |
| TO | North | 0 | 1 | -1 | 1 | 1 | -1 | -1 | 1 | 1 | -1 | -1 | 0 |
At the regional level, the consistency indicators (Table 7 and Table 8) reinforce these findings. The South region exhibits the highest positive score for females, indicating a relatively consistent upward trend over the study period. In contrast, the Southeast shows a negative cumulative score, suggesting either stabilization or gradual decline. For males, the South again stands out with a positive trend, while the Southeast presents the most negative score, indicating a more consistent reduction in rates.
Table 7: Regional consistency indicator (Trend score) for females
| Region | 2015 | 2016 | 2017 | 2018 | 2019 | 2020 | 2021 | 2022 | 2023 | 2024 | 2025 | Ranking |
|---|---|---|---|---|---|---|---|---|---|---|---|---|
| Northeast | 0.0 | 1.0 | 0.0 | 0.0 | 1.0 | -1.0 | 1.0 | -1.0 | 1.0 | -1.0 | 1.0 | 2.0 |
| North | 0.0 | 1.0 | -1.0 | 1.0 | -1.0 | -1.0 | 1.0 | 1.0 | 1.0 | -1.0 | -1.0 | 0.0 |
| Central-West | 0.0 | 1.0 | 1.0 | 1.0 | 1.0 | -1.0 | -1.0 | -1.0 | 1.0 | -1.0 | -1.0 | 0.0 |
| Southeast | 0.0 | -1.0 | -1.0 | 1.0 | -1.0 | -1.0 | 1.0 | 1.0 | 0.0 | 1.0 | -1.0 | -1.0 |
| South | 0.0 | 1.0 | 1.0 | 1.0 | 1.0 | -1.0 | 1.0 | 1.0 | 1.0 | 1.0 | -1.0 | 6.0 |
Overall, the results highlight three key patterns. First, there is a clear spatial concentration of higher victimization rates in the North and Central-West regions. Second, female victimization rates are substantially higher and more volatile than male rates, underscoring the gendered dynamics of sexual violence. Third, the combination of volatility and persistence revealed by the consistency indicators suggests that, in many regions, increases in reported cases are not merely episodic but reflect sustained underlying trends.
Table 8: Regional consistency indicator (Trend score) for males
| Region | 2015 | 2016 | 2017 | 2018 | 2019 | 2020 | 2021 | 2022 | 2023 | 2024 | 2025 | Ranking |
|---|---|---|---|---|---|---|---|---|---|---|---|---|
| Northeast | 0.0 | 1.0 | 1.0 | -1.0 | 1.0 | -1.0 | 1.0 | -1.0 | -1.0 | 1.0 | -1.0 | 0.0 |
| North | 0.0 | 1.0 | -1.0 | 1.0 | -1.0 | -1.0 | -1.0 | 1.0 | 1.0 | -1.0 | -1.0 | -2.0 |
| Central-West | 0.0 | -1.0 | 1.0 | 1.0 | 1.0 | -1.0 | -1.0 | -1.0 | 1.0 | -1.0 | -1.0 | -2.0 |
| Southeast | 0.0 | -1.0 | -1.0 | -1.0 | -1.0 | -1.0 | 0.0 | -1.0 | 1.0 | 1.0 | -1.0 | -5.0 |
| South | 0.0 | 0.0 | 1.0 | 1.0 | 1.0 | -1.0 | 1.0 | 1.0 | 0.0 | 1.0 | -1.0 | 4.0 |
These findings underscore the importance of region-specific policy interventions, as national averages may obscure critical local dynamics. Moreover, the coexistence of high levels and high volatility in certain states points to the need for improved data quality and reporting systems, as well as targeted prevention strategies that address the structural determinants of sexual violence.
The spatial distribution of Local Indicators of Spatial Association (LISA), presented in Figure 1 and Figure 2, provides a refined perspective on the geographic structure of sexual violence in Brazil by identifying statistically significant local clusters and spatial outliers.
For female victimization (Figure 1), the results reveal a persistent and geographically coherent pattern of spatial clustering over time. High-High (HH) clusters — representing spatial concentrations of elevated rates surrounded by similarly high values — are predominantly located in the North and Central-West regions. This pattern remains remarkably stable throughout the study period, suggesting the presence of deeply rooted structural determinants driving the spatial concentration of sexual violence. States such as Mato Grosso do Sul (MS), Rondônia (RO), and parts of the Amazon region consistently appear within these high-risk clusters, reinforcing the interpretation of spatial persistence rather than random fluctuation.
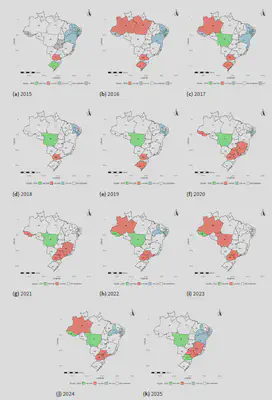
In contrast, Low-Low (LL) clusters are more frequently observed in portions of the Northeast and Southeast regions, indicating areas where relatively low victimization rates are spatially reinforced by neighboring units with similarly low levels. This spatial configuration suggests the existence of protective or mitigating regional dynamics, potentially associated with differences in institutional capacity, social policies, or reporting practices.
Beyond these core clusters, the presence of High-Low (HL) and Low-High (LH) spatial outliers provides additional insight into localized anomalies. HL configurations — high-rate states surrounded by low-rate neighbors — are indicative of isolated hotspots that do not conform to broader regional trends, while LH patterns may signal areas of relative resilience embedded within high-risk regions. Although less frequent, these outliers are critical for identifying localized deviations that may be driven by specific institutional, demographic, or socioeconomic factors.
From a temporal perspective, the evolution of LISA clusters for females suggests a combination of persistence and episodic disruption. Notably, the period around 2020 exhibits a partial fragmentation of previously stable clusters, likely reflecting the impact of the COVID-19 pandemic on both the incidence and reporting of sexual violence. This disruption is followed by a reconfiguration and, in several cases, a re-emergence of prior clustering patterns in subsequent years (2021–2025), reinforcing the hypothesis that the observed spatial structures are fundamentally structural rather than transient.
The LISA results for male victimization (Figure 2) exhibit both similarities and important distinctions when compared to the female patterns. While the overall intensity and spatial extent of clusters are considerably reduced — consistent with the lower magnitude of male victimization rates — the geographic distribution of clusters partially mirrors that observed among females. In particular, the Central-West region again emerges as a focal point of High-High clustering, suggesting that shared structural factors influence the spatial distribution of sexual violence across genders.
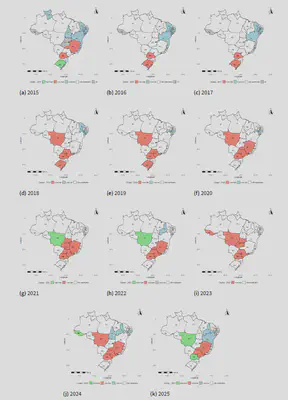
However, male LISA patterns are characterized by greater spatial fragmentation and temporal instability. High-High clusters appear less consistently across years, and transitions between cluster types are more frequent. This volatility may reflect a combination of smaller case numbers, higher sensitivity to reporting fluctuations, and potentially greater underreporting among male victims. Consequently, while the spatial signal remains detectable, it is comparatively weaker and less stable.
Another notable feature of the male LISA maps is the more frequent occurrence of non-significant spatial patterns, indicating that, in many regions, local spatial autocorrelation is not strong enough to form statistically robust clusters. This contrasts with the more clearly defined clustering observed for females and further emphasizes the gendered nature of spatial dynamics in sexual violence.
Taken together, the LISA analyses highlight three central findings. First, there is clear evidence of spatial dependence in the distribution of sexual violence, particularly among females, with well-defined and persistent clusters in specific regions. Second, these spatial patterns are not static but exhibit periods of disruption and reorganization, reflecting the influence of external shocks such as the COVID-19 pandemic. Third, while male victimization shares some spatial characteristics with female patterns, it is marked by lower intensity, greater instability, and weaker spatial autocorrelation.
These results underscore the importance of incorporating spatially explicit approaches in the analysis of sexual violence. The identification of persistent high-risk clusters points to the need for geographically targeted public policies, while the detection of spatial outliers highlights the relevance of localized interventions. Moreover, the differences observed between male and female patterns reinforce the necessity of gender-sensitive analytical frameworks that account for both shared and distinct underlying mechanisms.
Conclusions
This study provides a comprehensive assessment of rape victimization patterns in Brazil over a ten-year period, highlighting substantial spatial and temporal heterogeneity across Federative Units and regions. The evidence consistently demonstrates that the North and Central-West regions concentrate the highest levels of vulnerability, particularly among females, while the Southeast and South exhibit comparatively lower, albeit not negligible, rates.
A key contribution of this analysis lies in the integration of magnitude and directionality measures. While raw rates and smoothed averages reveal the scale and distribution of the phenomenon, the consistency indicators offer critical insights into the persistence of trends. The results suggest that increases in victimization are not merely sporadic but, in several cases, reflect sustained trajectories, especially in specific states and regions.
Moreover, the findings reinforce the strongly gendered nature of sexual violence, with female victimization rates substantially exceeding those of males across all contexts. Nevertheless, the presence of similar spatial patterns in male victimization indicates that broader structural and regional factors — such as socioeconomic conditions, institutional capacity, and reporting practices — play a significant role in shaping these outcomes.
The incorporation of Local Indicators of Spatial Association (LISA) further strengthens the analytical framework by explicitly capturing localized spatial dependence. The LISA results reveal the existence of statistically significant and persistent spatial clusters, particularly High-High configurations in the North and Central-West regions, indicating that elevated victimization rates are not randomly distributed but spatially concentrated. Conversely, Low-Low clusters observed in parts of the Northeast and Southeast reinforce the presence of geographically structured areas of lower vulnerability.
Importantly, the spatial patterns identified through LISA exhibit a high degree of temporal persistence, suggesting that the geographic concentration of sexual violence is driven by structural rather than transitory factors. Although temporary disruptions — especially during the COVID-19 period — led to partial fragmentation of clusters, the subsequent re-emergence of similar spatial configurations underscores the resilience of these underlying spatial processes.
For male victimization, the LISA analysis reveals weaker and more fragmented spatial autocorrelation, reflecting both the lower magnitude of rates and potential issues related to underreporting. Nonetheless, the partial overlap in spatial clustering between male and female patterns suggests that common regional determinants continue to play a relevant role across genders.
The observed volatility in certain states also raises important concerns regarding data quality and reporting consistency. Abrupt fluctuations may reflect changes in institutional practices, awareness campaigns, or access to reporting mechanisms, rather than actual variations in incidence. Therefore, strengthening data systems and standardizing reporting procedures are essential steps toward more accurate monitoring and effective policy design.
From a policy perspective, the results underscore the inadequacy of uniform national strategies. Instead, targeted interventions tailored to regional specificities are required, particularly in high-vulnerability areas. Preventive measures should be complemented by investments in victim support services, institutional strengthening, and public awareness initiatives. The identification of persistent spatial clusters further emphasizes the need for geographically focused policies capable of addressing localized risk environments.
In conclusion, this study advances the empirical understanding of sexual violence in Brazil by combining multiple analytical dimensions and highlighting the importance of regional heterogeneity and spatial dependence. The integration of LISA-based evidence demonstrates that sexual violence is not only unevenly distributed but also spatially structured in a persistent manner. Future research should explore causal determinants and incorporate socioeconomic and institutional variables to further elucidate the mechanisms underlying the observed spatial patterns.
Henrique José de Paula Alves
Searcher
Meus interesses em pesquisa incluem Estatística Espacial com ênfase em Geoestatística, Análise Multivariada, Métodos de Reamostragem Bootstrap, Simulação Computacional Intensiva matter.